When the 8-Ball Meets AI Pricing
The Social Capital playbook holds. Two new failure modes need new instruments.
Your AI product is growing. Usage is up, revenue follows, the numbers on the dashboard point in the right direction. But something feels off. The SaaS metrics you’ve absorbed from VC Twitter and board decks don’t map cleanly to your reality. Rule of 40 tells you growth-plus-margin exceeds a threshold. Burn Multiple tells you how much you spend per dollar of new ARR. Both are useful. Both are thermometers: they tell you the patient’s temperature, not what’s wrong.
What is your growth composed of? How much comes from expansion versus new logos versus resurrection of churned accounts? How does customer value evolve over time, and how is it distributed across your base? Is engagement concentrated in a handful of power users or spread across the cohort? These are diagnostic questions. Thermometers don’t answer them.
In 2015, Jonathan Hsu and the data team at Social Capital built a diagnostic they called the 8-Ball: a quantitative toolkit for measuring product-market fit, designed from the start to be metric-agnostic.
Someone already built the MRI
The 8-Ball addressed a specific frustration: founders and investors treated “product-market fit” as binary (you have it or you don’t), when the real question was always about degree, composition, and trajectory. Hsu later refined and unified the approach at Tribe Capital, but the core architecture was set at Social Capital and published. The source material is worth reading in full; what follows is orientation, not a tutorial.
The 8-Ball runs three analyses, each answering a question the operator already has:
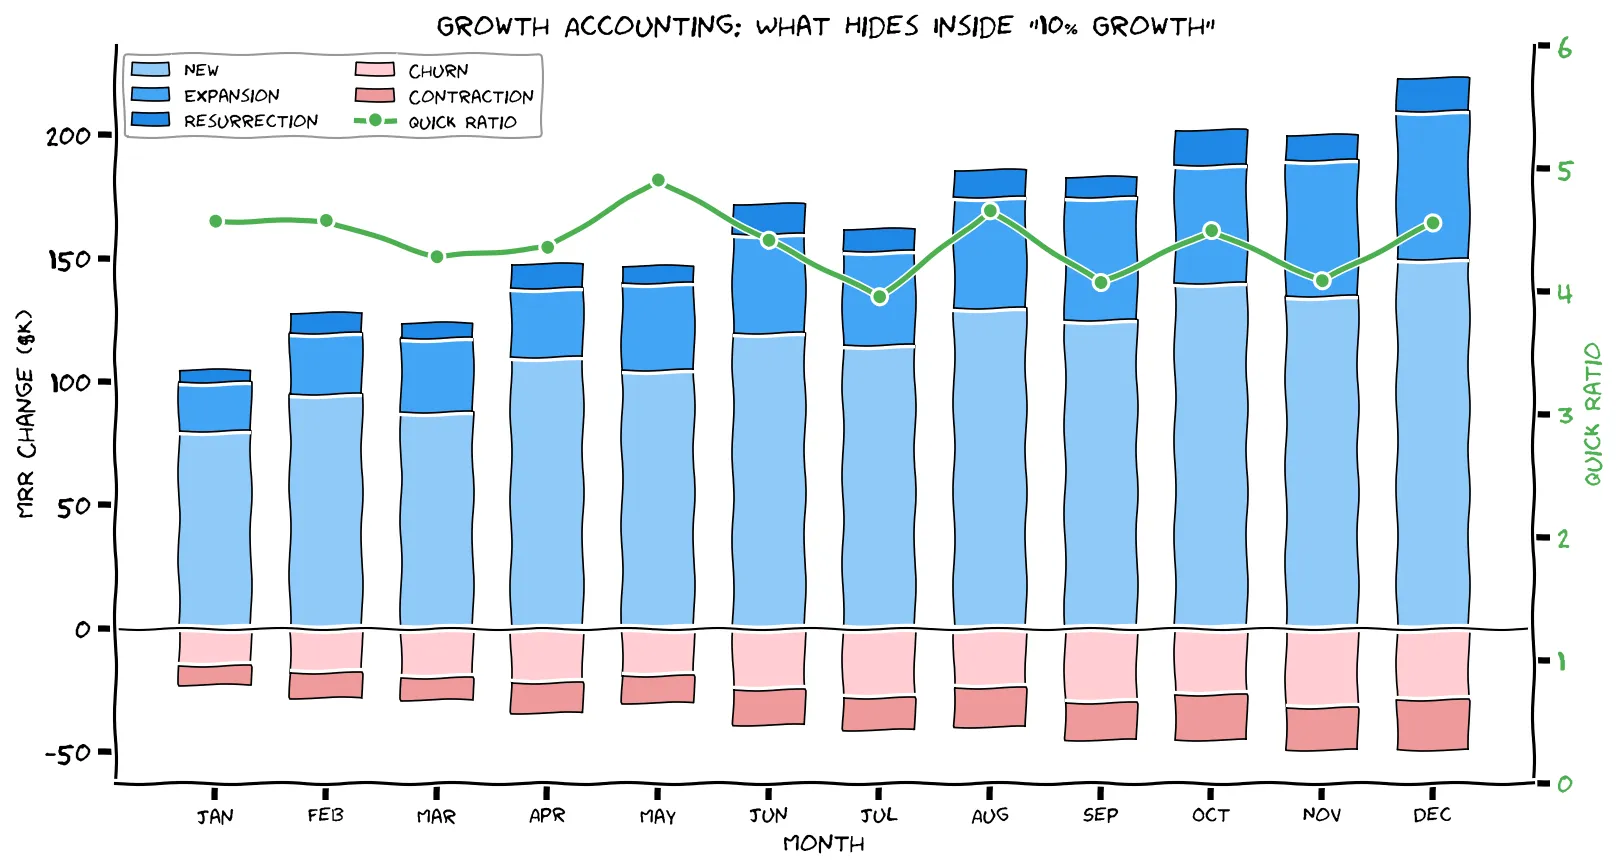
Growth accounting. How is your growth composed? Net growth is a single number that hides its own structure. Growth accounting decomposes it into new, expansion, resurrection, and contraction/churn. A company growing 10% monthly from new customer acquisition looks identical on the dashboard to one growing 10% from expansion of existing accounts. The operational reality behind those two numbers is different. The Quick Ratio (gross additions divided by gross losses) captures how much acquisition pressure you need to sustain growth: a Quick Ratio of 4 means you’re adding four dollars for every dollar lost, which is healthy. A Quick Ratio of 1.5 means you’re on a treadmill.
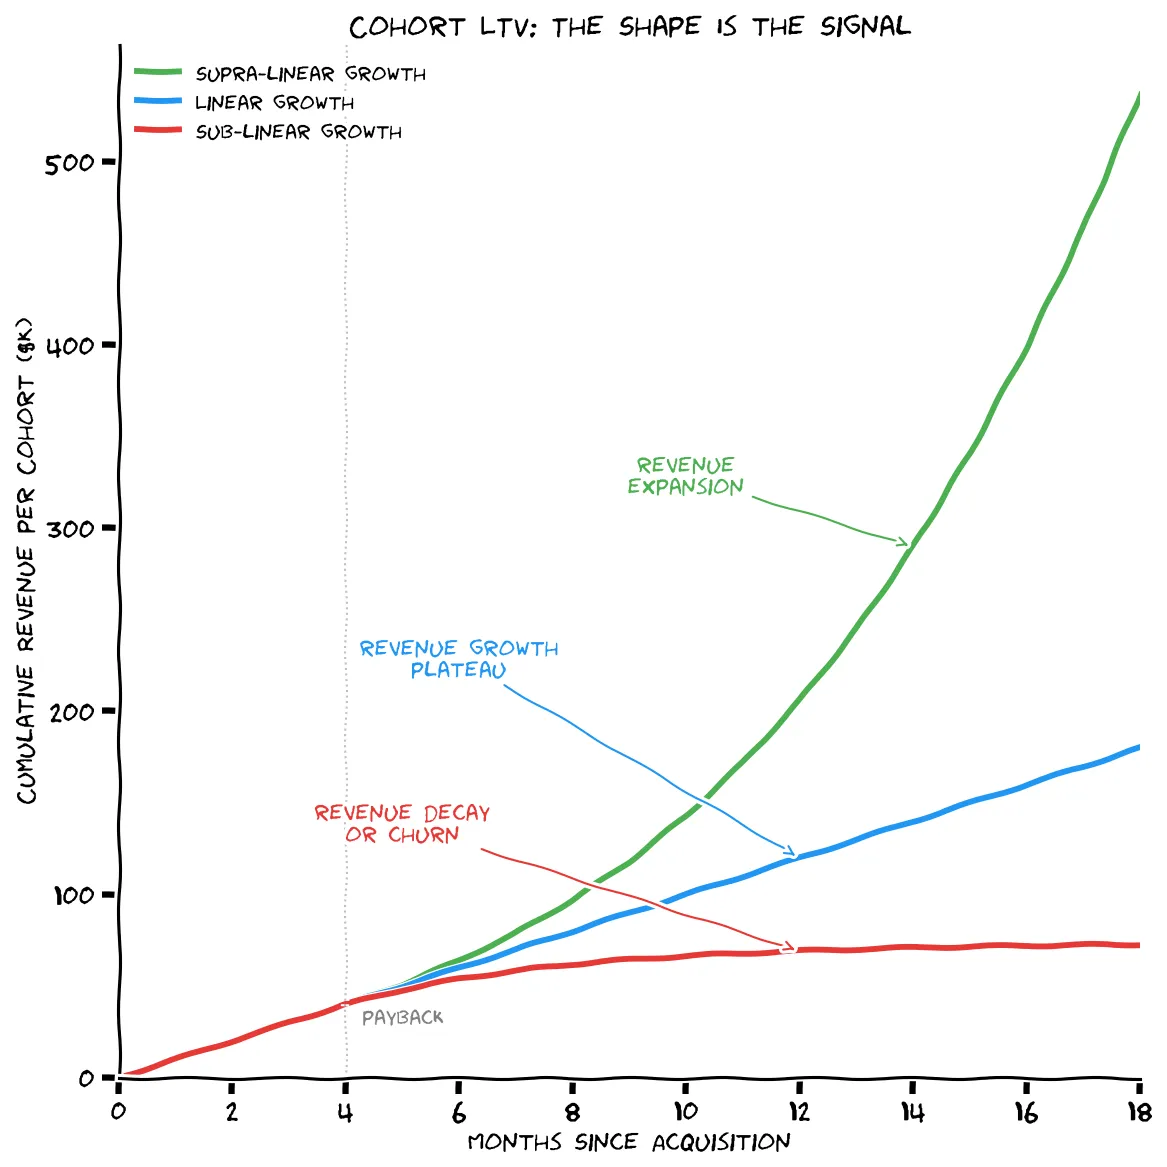
Cohort LTV. How does customer value evolve over time? Cumulative revenue by cohort, tracked over months since acquisition. The shape of the curve after payback is the signal. Three patterns: supra-linear growth (revenue expansion), where revenue per period increases and the cumulative curve accelerates. Linear growth (revenue growth plateau), where revenue per period holds steady and the cumulative curve climbs at a constant slope. Or sub-linear growth (revenue decay or churn), where revenue per period declines and the cumulative curve bends toward flat. Payback period, long-term unit economics, and the viability of your acquisition spend all live in this curve. A cohort that pays back in four months and then bends upward is a different business from one that pays back in four months and then flatlines, even though they look identical at the payback mark.
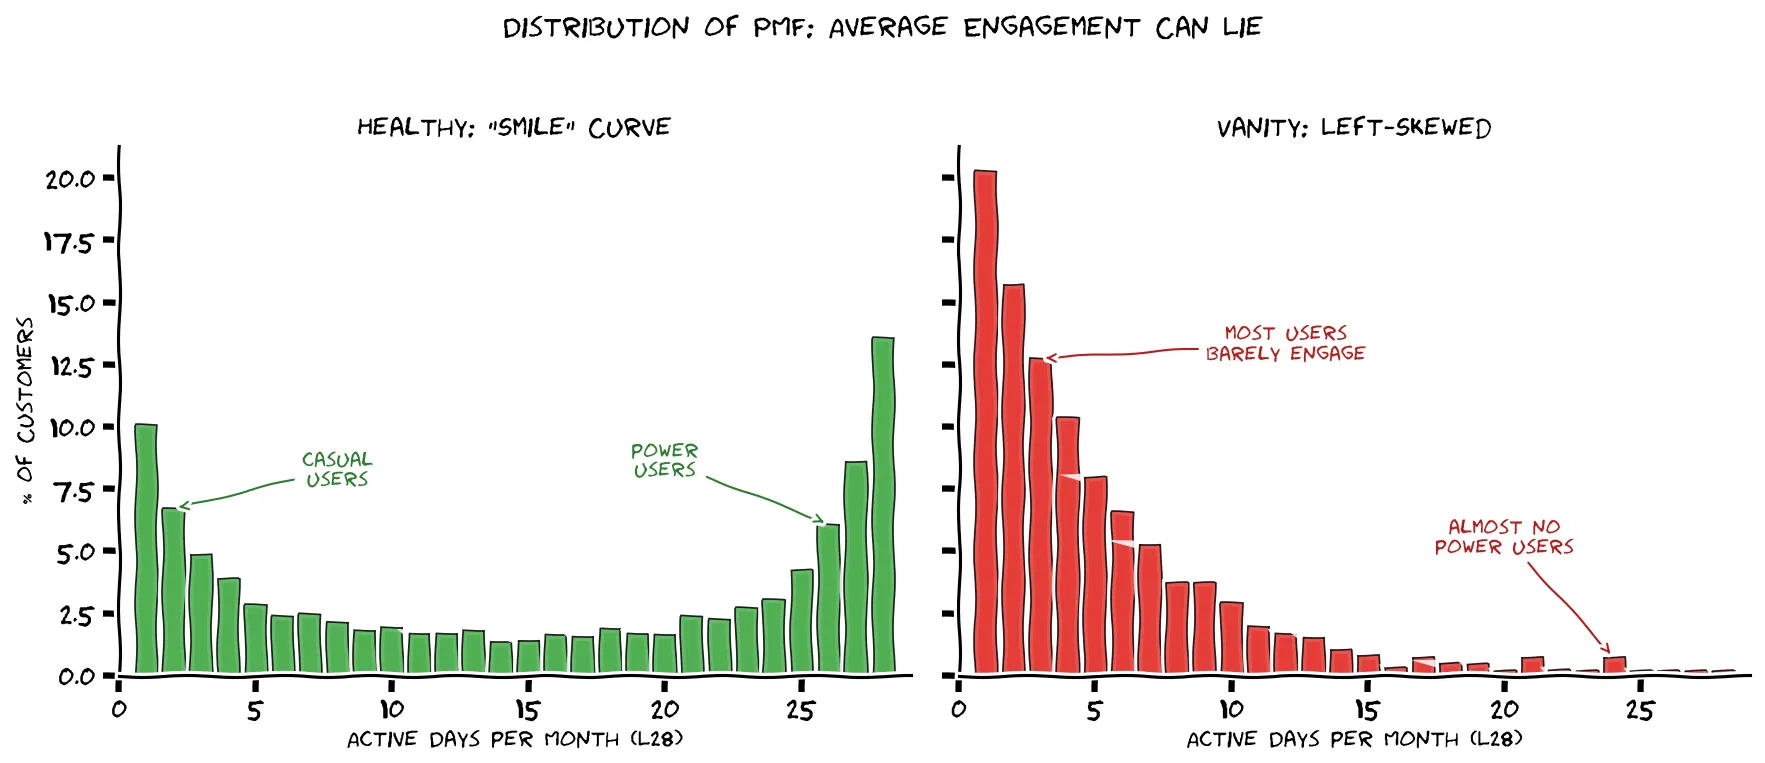
Distribution of PMF. How is engagement spread across your base? The L28 analysis measures how many days per month each customer is active, then plots the distribution. A healthy product shows a smile curve: a cluster of highly engaged users on the right side, with a dip in the middle. A product with vanity engagement metrics but weak PMF shows a left-skewed distribution, lots of low-engagement accounts inflating the count. The shape tells you whether your average engagement metric is representative or misleading.
One detail matters for what follows. Hsu designed these analyses to be metric-agnostic. His “LTV of Everything” generalization made explicit that the framework applies to any value metric, not just seat-based MRR. That design choice turns out to be the right one for a world where the value metric shifts from seats to consumption.
Engagement IS revenue
Here is where usage-based pricing gives you something seat-based SaaS never had.
In a seat-based model, engagement and revenue are weakly coupled. A customer pays the same monthly fee whether they log in daily or once a quarter. You measure engagement separately (DAU, L28, feature adoption) and revenue separately (MRR, expansion, churn), and you hope they correlate. Often they do. But the coupling is indirect, mediated by renewal decisions that happen quarterly or annually. A disengaged customer still pays until the contract expires.
Usage-based pricing collapses that gap. When the customer pays per API call, per task, or per token, engagement is revenue. The L28 distribution stops being an engagement proxy and becomes a revenue distribution directly. Growth accounting runs on the usage metric, and the results are simultaneously engagement and revenue results. You don’t need separate passes.
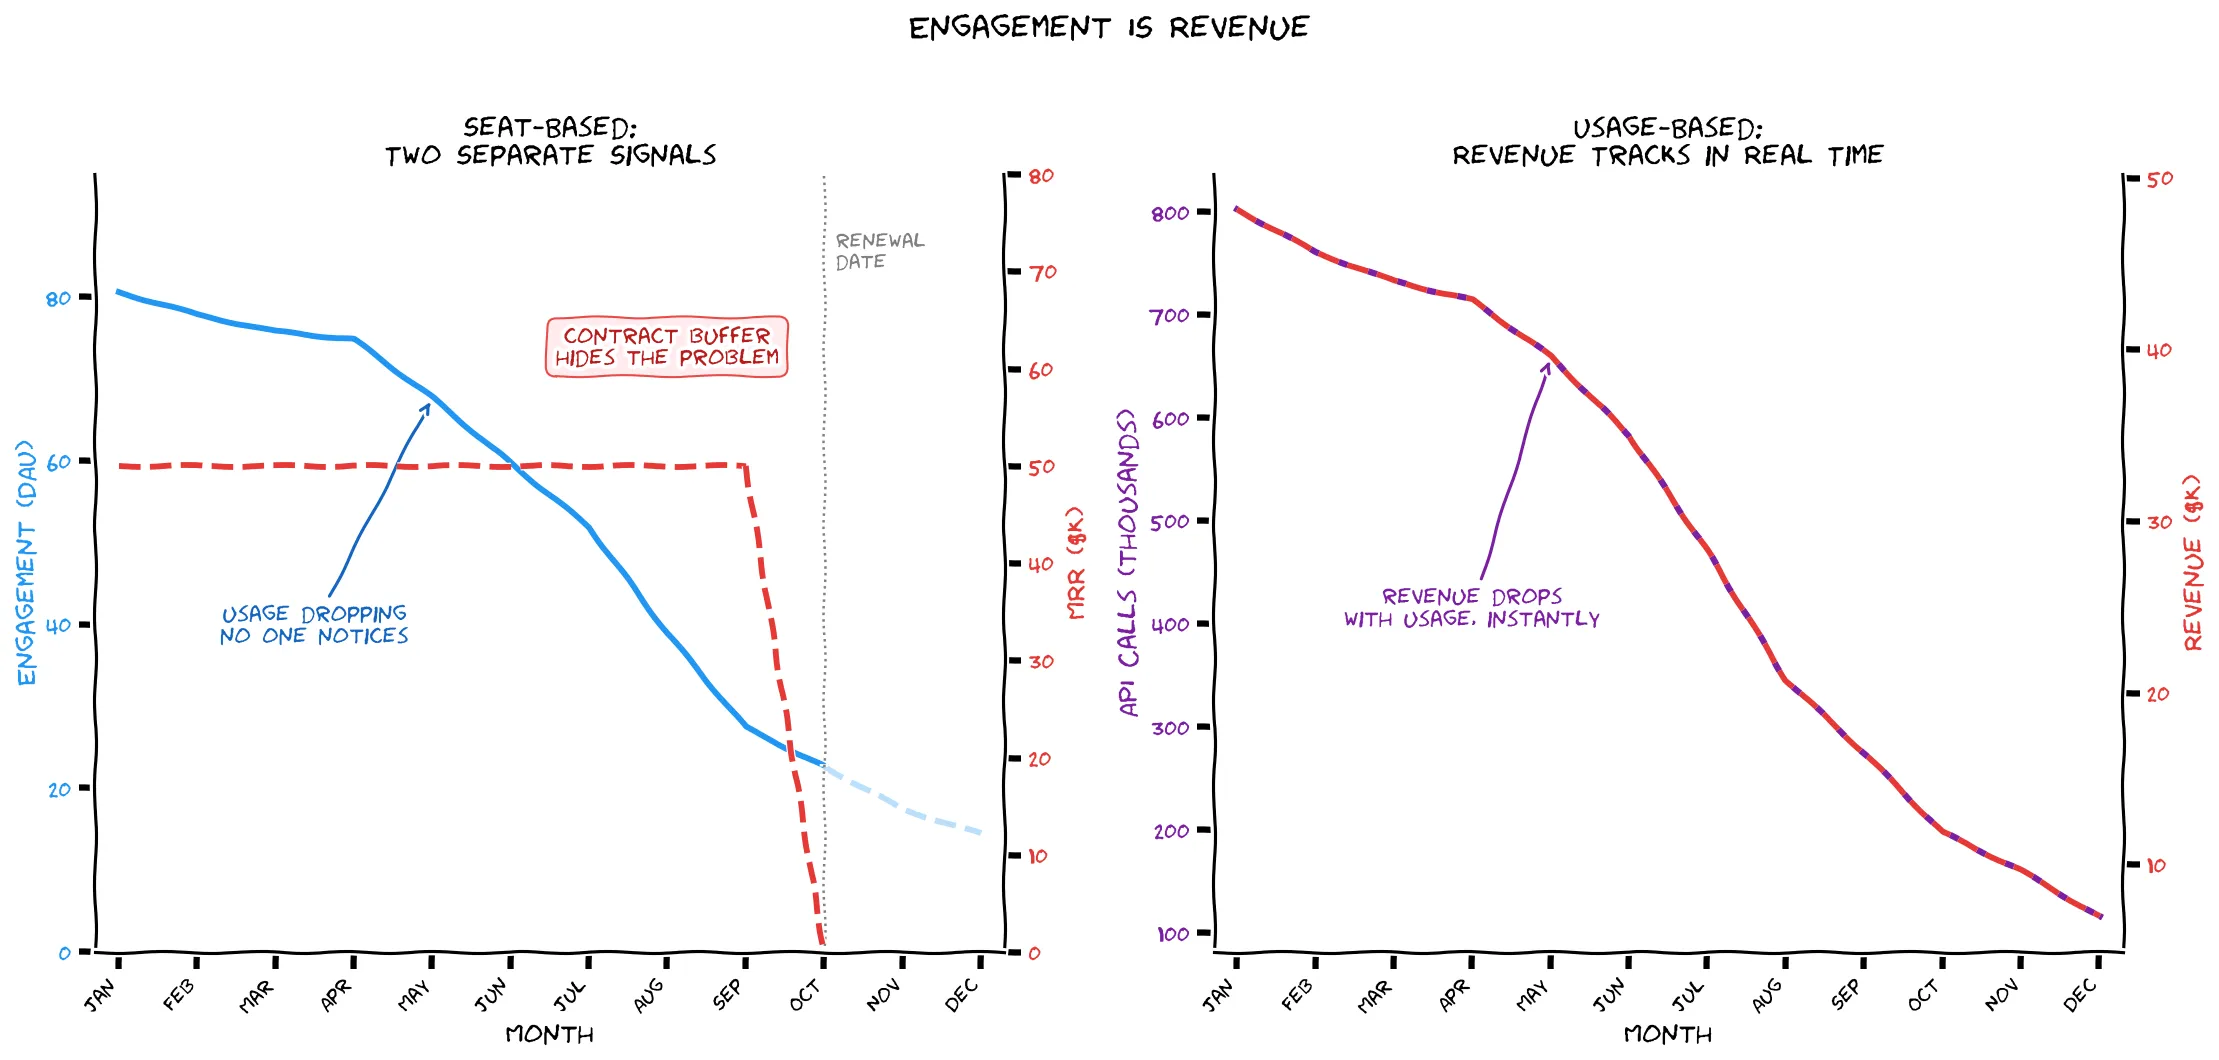
Take an AI document-processing product that charges per document analyzed. A customer processing 500 documents last month and 800 this month didn’t just become more engaged. They generated 60% more revenue. If that pattern holds across the cohort, expansion revenue isn’t a lagging signal from a usage trend; it’s the same signal, measured the same way, in real time. The Quick Ratio on usage captures retention health and revenue dynamics in a single metric. It’s more diagnostic than the MRR Quick Ratio ever was in seat-based models, because there’s no contract buffer hiding a disengaged customer who hasn’t churned yet.
This is the good news. Hsu’s frameworks don’t just transfer to usage-based models; they get sharper. The metric-agnostic design he built turns out to be the right architecture for a world where engagement and monetization unify.
The bad news is that this unification introduces problems seat-based SaaS could afford to ignore.
When margins move
Scale invariance is one of Hsu’s sharpest concepts: healthy unit economics should hold as the business grows. In seat-based SaaS, the primary threat to scale invariance is CAC deterioration. You exhaust your best acquisition channels and each incremental customer costs more. The unit economics that worked at $1M ARR may not hold at $10M.
Usage-based AI products inherit that problem and add a second: gross margin deterioration. Inference costs are variable, driven partly by forces outside your control, and they can move at a pace that seat-based COGS never did. A model provider raises prices. A new model version generates more tokens per request. Your power users discover expensive reasoning-heavy workflows. Margins shift, and the shift can be sudden.
The diagnostic I’d propose is a margin decomposition tree:
cost per task
│
├── tokens per task
│   ├── input tokens      [i]
│   │       +
│   ├── output tokens     [m]
│   │       +
│   └── thinking tokens   [m]
│
│       ×
│
└── effective cost per token
    ├── provider rates    [e]
    │       ×
    └── routing mix       [i]

[i] internal
[m] mixed
[e] external
Each branch maps to a different degree of control. Input tokens are driven by your system prompt and context design, largely yours to manage. Output tokens depend on task complexity and model behavior. Thinking and reasoning tokens depend on model architecture but are partly within your control through model selection, reasoning budget parameters, and prompt design. On the cost side, provider rates are set by your model vendors, while your routing mix (which models handle which tasks, whether you use tiered inference, how aggressively you cache) is yours.
The operator monitors cost per task at the top level. When it moves, the tree tells you which branch moved, and each branch has a different operational response. Rising input tokens might mean your system prompts need compression. Rising reasoning tokens might mean a model update changed behavior. Rising provider rates are outside your control but can be offset by adjusting routing mix.
At cohort level, the Hsu-native diagnostic applies directly: is margin stable across cohorts at the same age? Within a single cohort as it ages? A super-linear usage growth curve paired with declining per-unit margins produces misleadingly optimistic payback calculations. The cohort LTV curve looks strong, but the margin embedded in that revenue is eroding underneath it. You need both curves: revenue and margin, by cohort, tracked together.
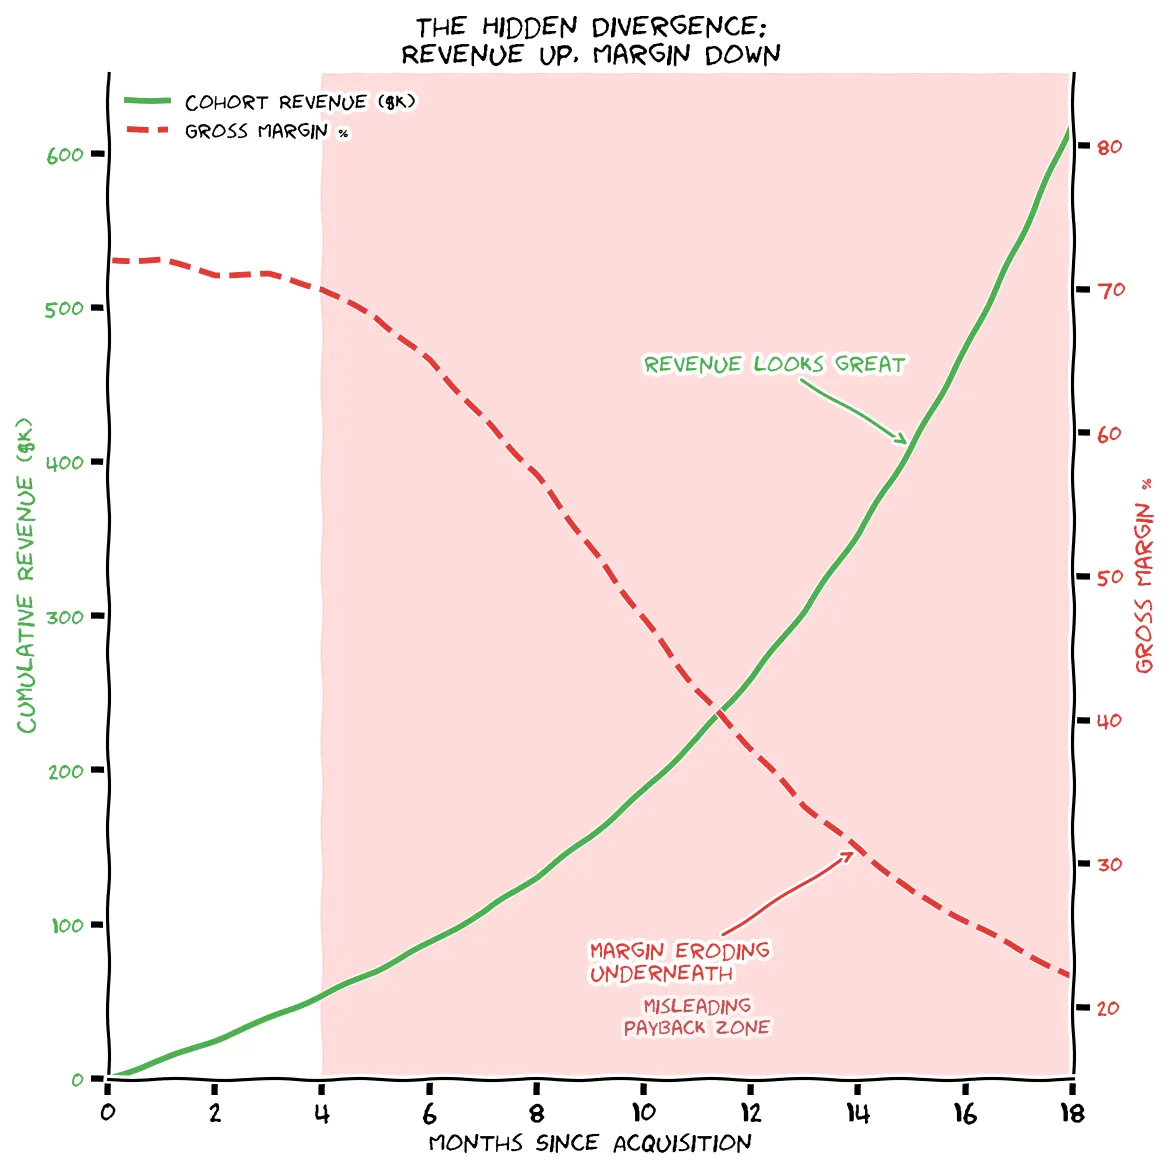
Hsu’s own MagicMoneyCo example illustrates a version of this: strong PMF signals, negative unit economics. In seat-based SaaS that’s primarily a pricing problem. In usage-based AI, it’s a structural problem that can worsen with scale rather than resolve. The decomposition tree is my proposed instrument for diagnosing where the margin pressure comes from and what the operator can do about each source. It’s not a battle-tested standard (the failure mode is too new for that), but the structure maps to operational decisions, and cohort-level margin tracking is a natural extension of what Hsu’s framework already does.
The whale in the room
Seat-based pricing mechanically caps per-customer revenue. A customer with 50 seats pays 50 times the per-seat price, and that’s the ceiling until headcount grows. Usage-based pricing has no such cap. A single power customer running millions of API calls could represent 30%, 50%, or more of your total consumption.
This makes quality-of-revenue analysis urgent. The right diagnostic is a Lorenz curve of revenue concentration. Sort customers from highest revenue to lowest, then plot cumulative percentage of customers on the x-axis against their cumulative share of total revenue on the y-axis. The diagonal represents perfect equality: every customer contributes the same. The further the curve bows above the diagonal, the more concentrated your revenue. In a healthy business with a typical 60/20 distribution, the top 20% of customers account for about 60% of revenue. In a whale-dominated business, the curve rockets upward: 2% of customers might account for 90% of revenue. How that shape changes over time is the signal.
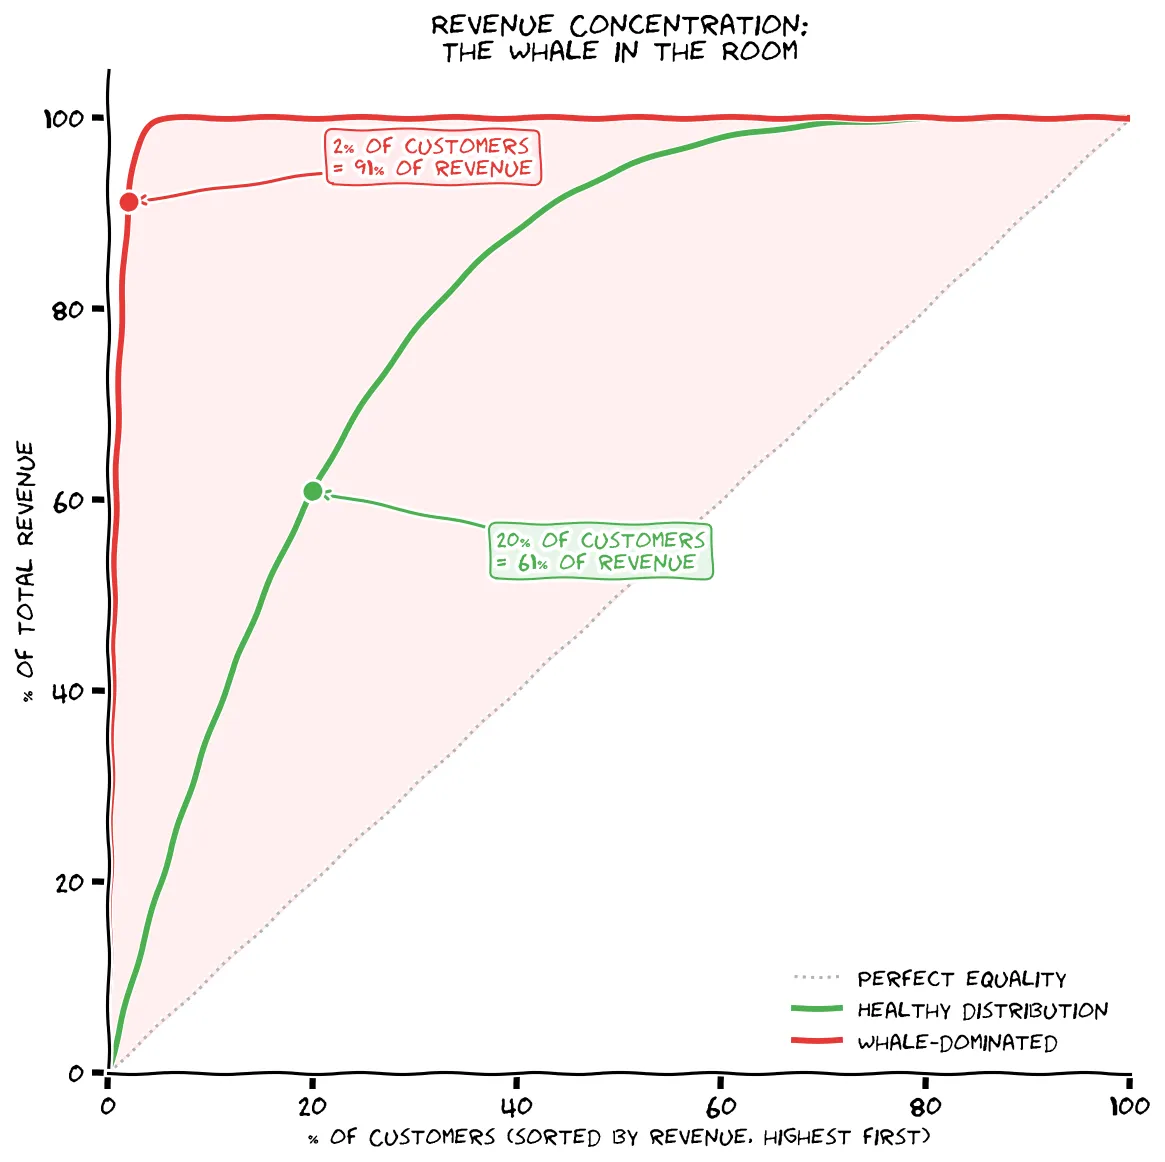
Concentration isn’t inherently bad. Many successful businesses have whale customers. But in usage-based AI products, concentration carries a specific risk: your biggest customer’s usage patterns drive your aggregate margin and growth metrics disproportionately. If the whale reduces consumption, your growth flips from supra-linear to sub-linear in a single month. Your blended margin reflects the cost profile of your whale, not your typical customer’s. The decomposition tree from the previous section becomes essential here: you need to know not just that margins moved, but whether it was the whale that moved them.
A related problem (contracted but unconsumed usage, sometimes called “fake revenue”) is well understood and has known operational responses. It matters, but it’s not where the new danger lives. The new danger is real consumption, heavily concentrated, with margin characteristics that may differ from the rest of the base.
The frameworks exist. The 8-Ball gives you the diagnostic architecture: growth accounting, cohort LTV, distribution of PMF. Usage-based pricing makes those analyses sharper by collapsing engagement and revenue into a single signal. The new failure modes (margin volatility and revenue concentration) are identifiable, and the tools to monitor them build naturally on the cohort-level foundation Hsu laid down a decade ago.
Recalibrate, don’t reinvent.
In a follow-up piece, I’ll walk through these diagnostics on a synthetic AI company: real frameworks, simulated data, and visualizations.